DevOps Product Hub
Curated products, software and apps from the DevOps World.
Grafana Cloud
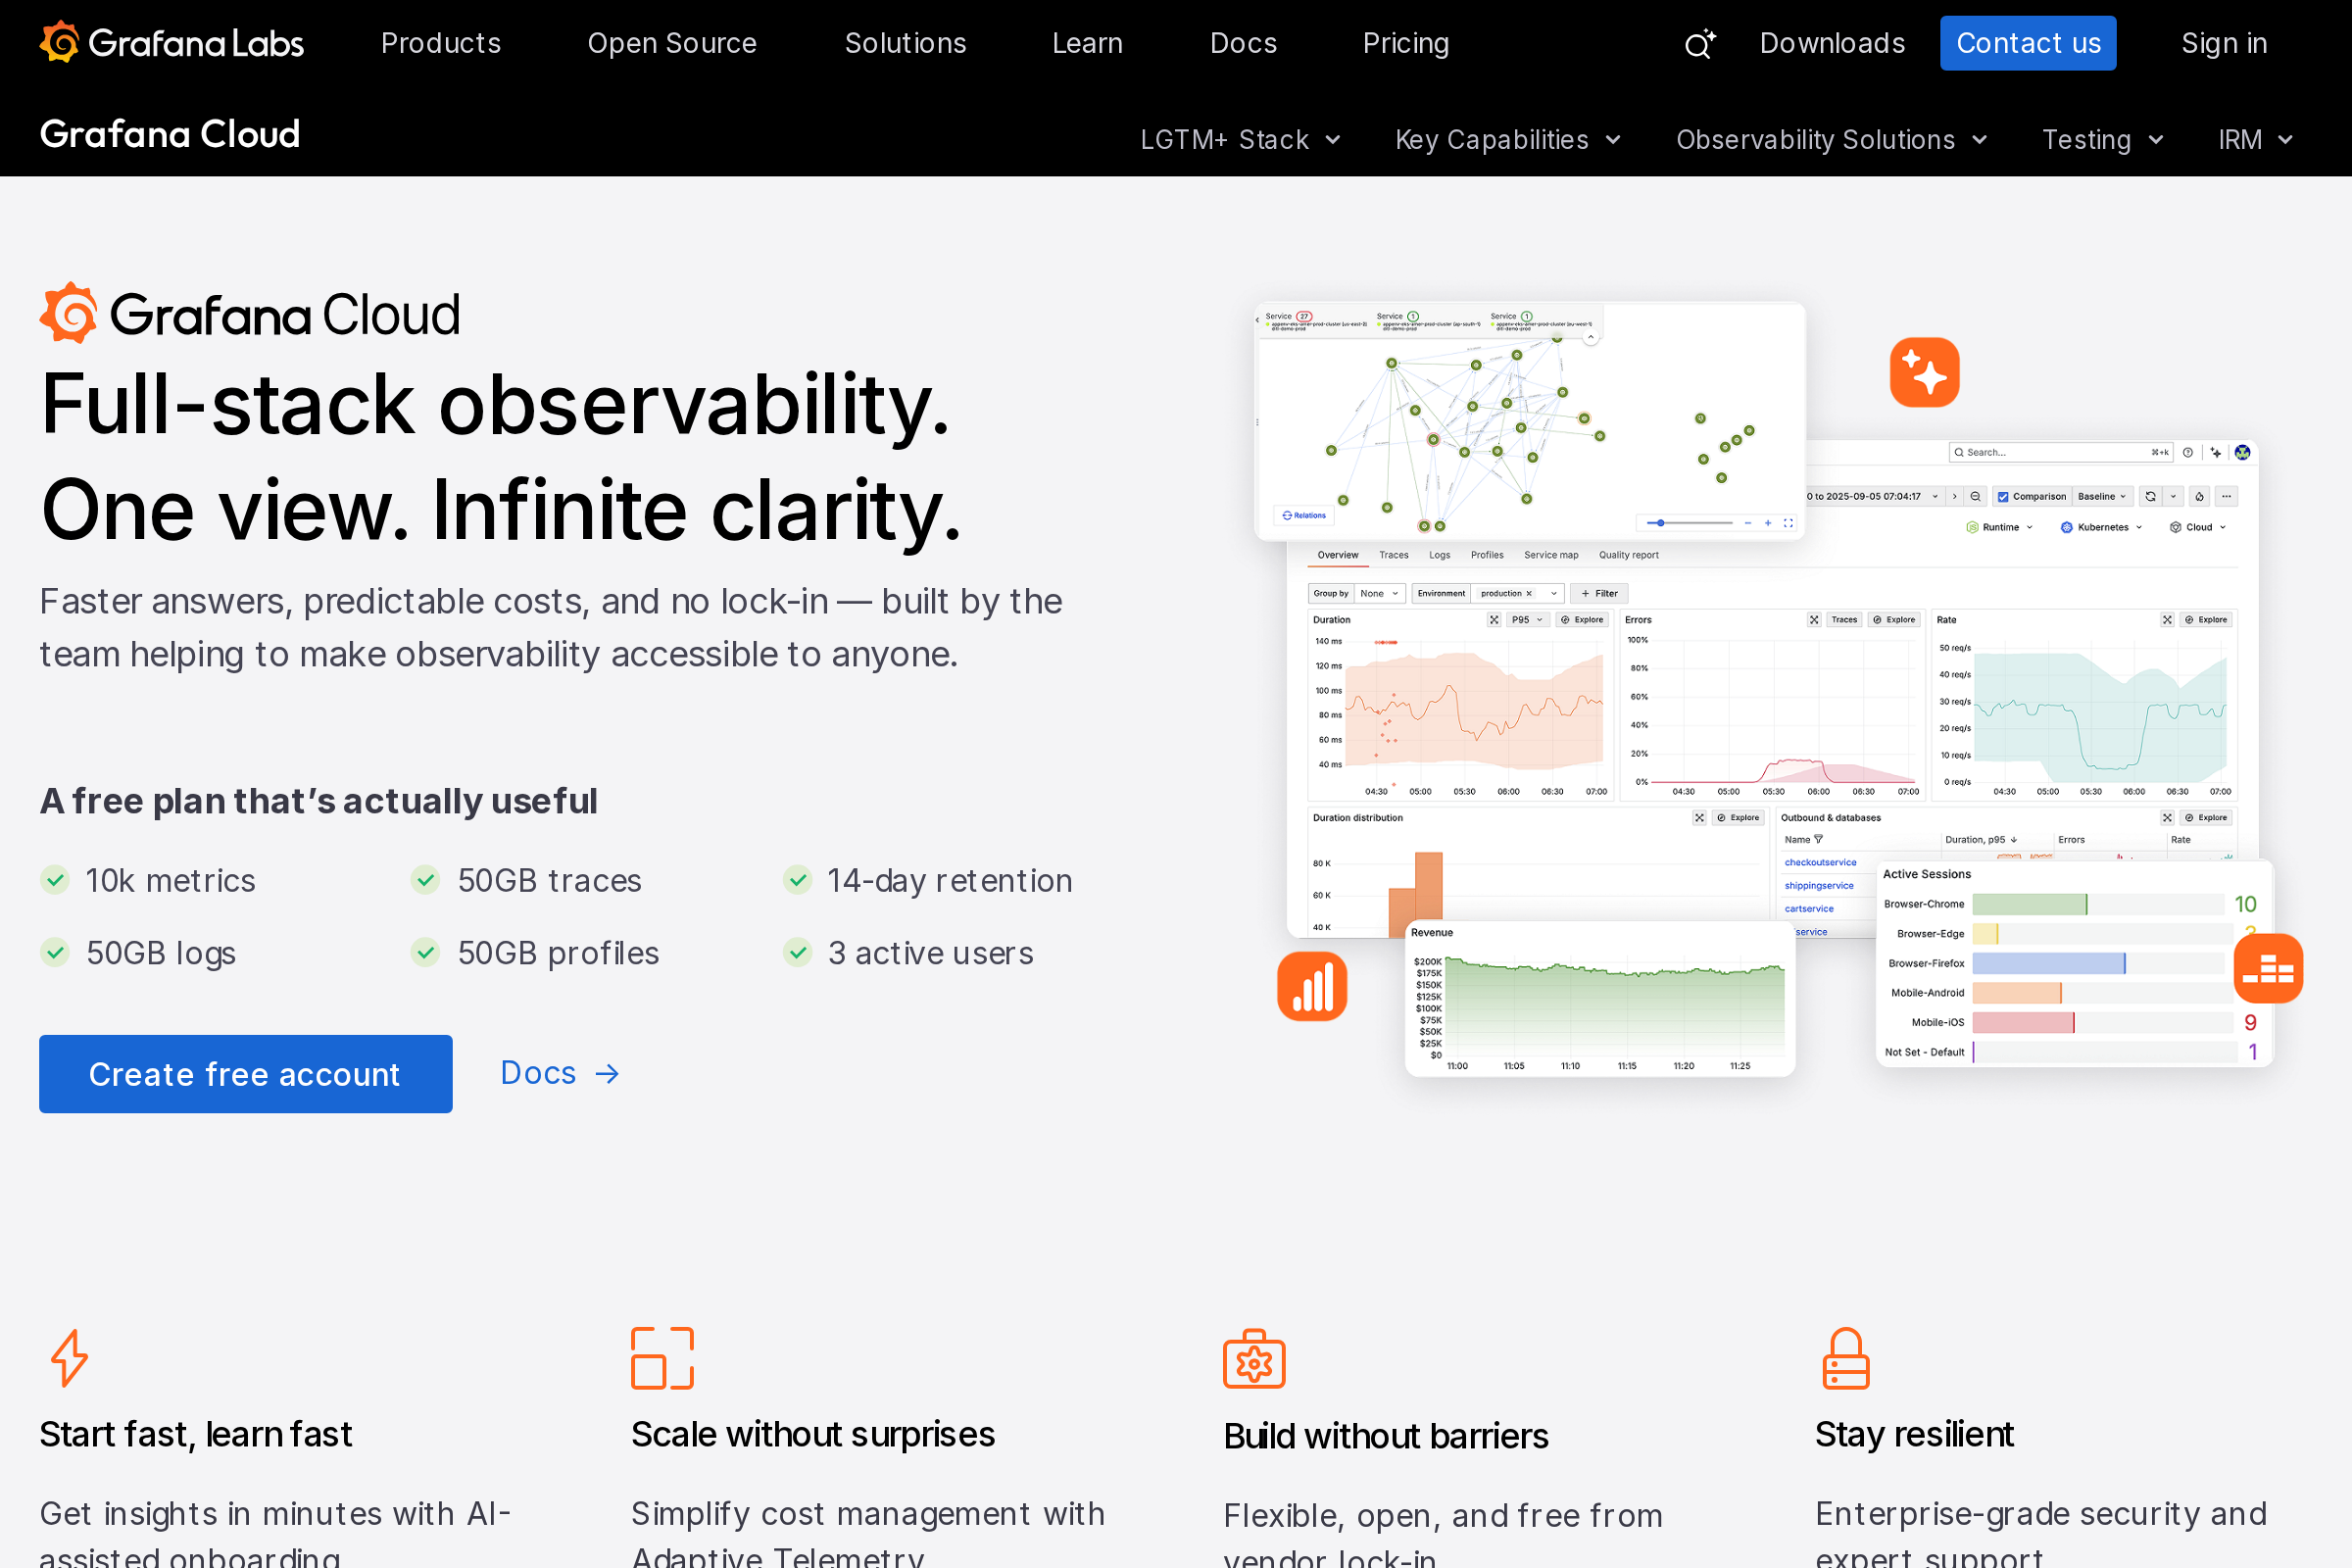
Cloud-based observability platform for real-time insights.
Grafana Cloud is a fully-managed observability platform that combines metrics, logs, and traces to provide real-time insights across your organization. With Grafana Cloud, teams can effortlessly visualize their data from multiple sources in a single unified dashboard, making it easier to identify performance bottlenecks and troubleshoot issues. It is especially popular for its seamless integration with various data sources such as Prometheus, InfluxDB, and AWS CloudWatch, among others.
One of the key features of Grafana Cloud is its ability to support collaboration among team members through customizable dashboards and notifications. Users can set alerts based on specific metrics, ensuring that potential issues are addressed proactively. In addition to its robust visualization capabilities, Grafana Cloud offers a tiered pricing model, allowing teams to choose a plan that suits their needs, whether they are small startups or large enterprises. This flexibility and its powerful features make Grafana Cloud a popular choice in the DevOps community for monitoring network performance and system reliability.
One of the key features of Grafana Cloud is its ability to support collaboration among team members through customizable dashboards and notifications. Users can set alerts based on specific metrics, ensuring that potential issues are addressed proactively. In addition to its robust visualization capabilities, Grafana Cloud offers a tiered pricing model, allowing teams to choose a plan that suits their needs, whether they are small startups or large enterprises. This flexibility and its powerful features make Grafana Cloud a popular choice in the DevOps community for monitoring network performance and system reliability.


Product
Useful Links
Made with pure grit © 2026 Jetpack Labs Inc. All rights reserved. www.jetpacklabs.com