DevOps Product Hub
Curated products, software and apps from the DevOps World.
Grafana
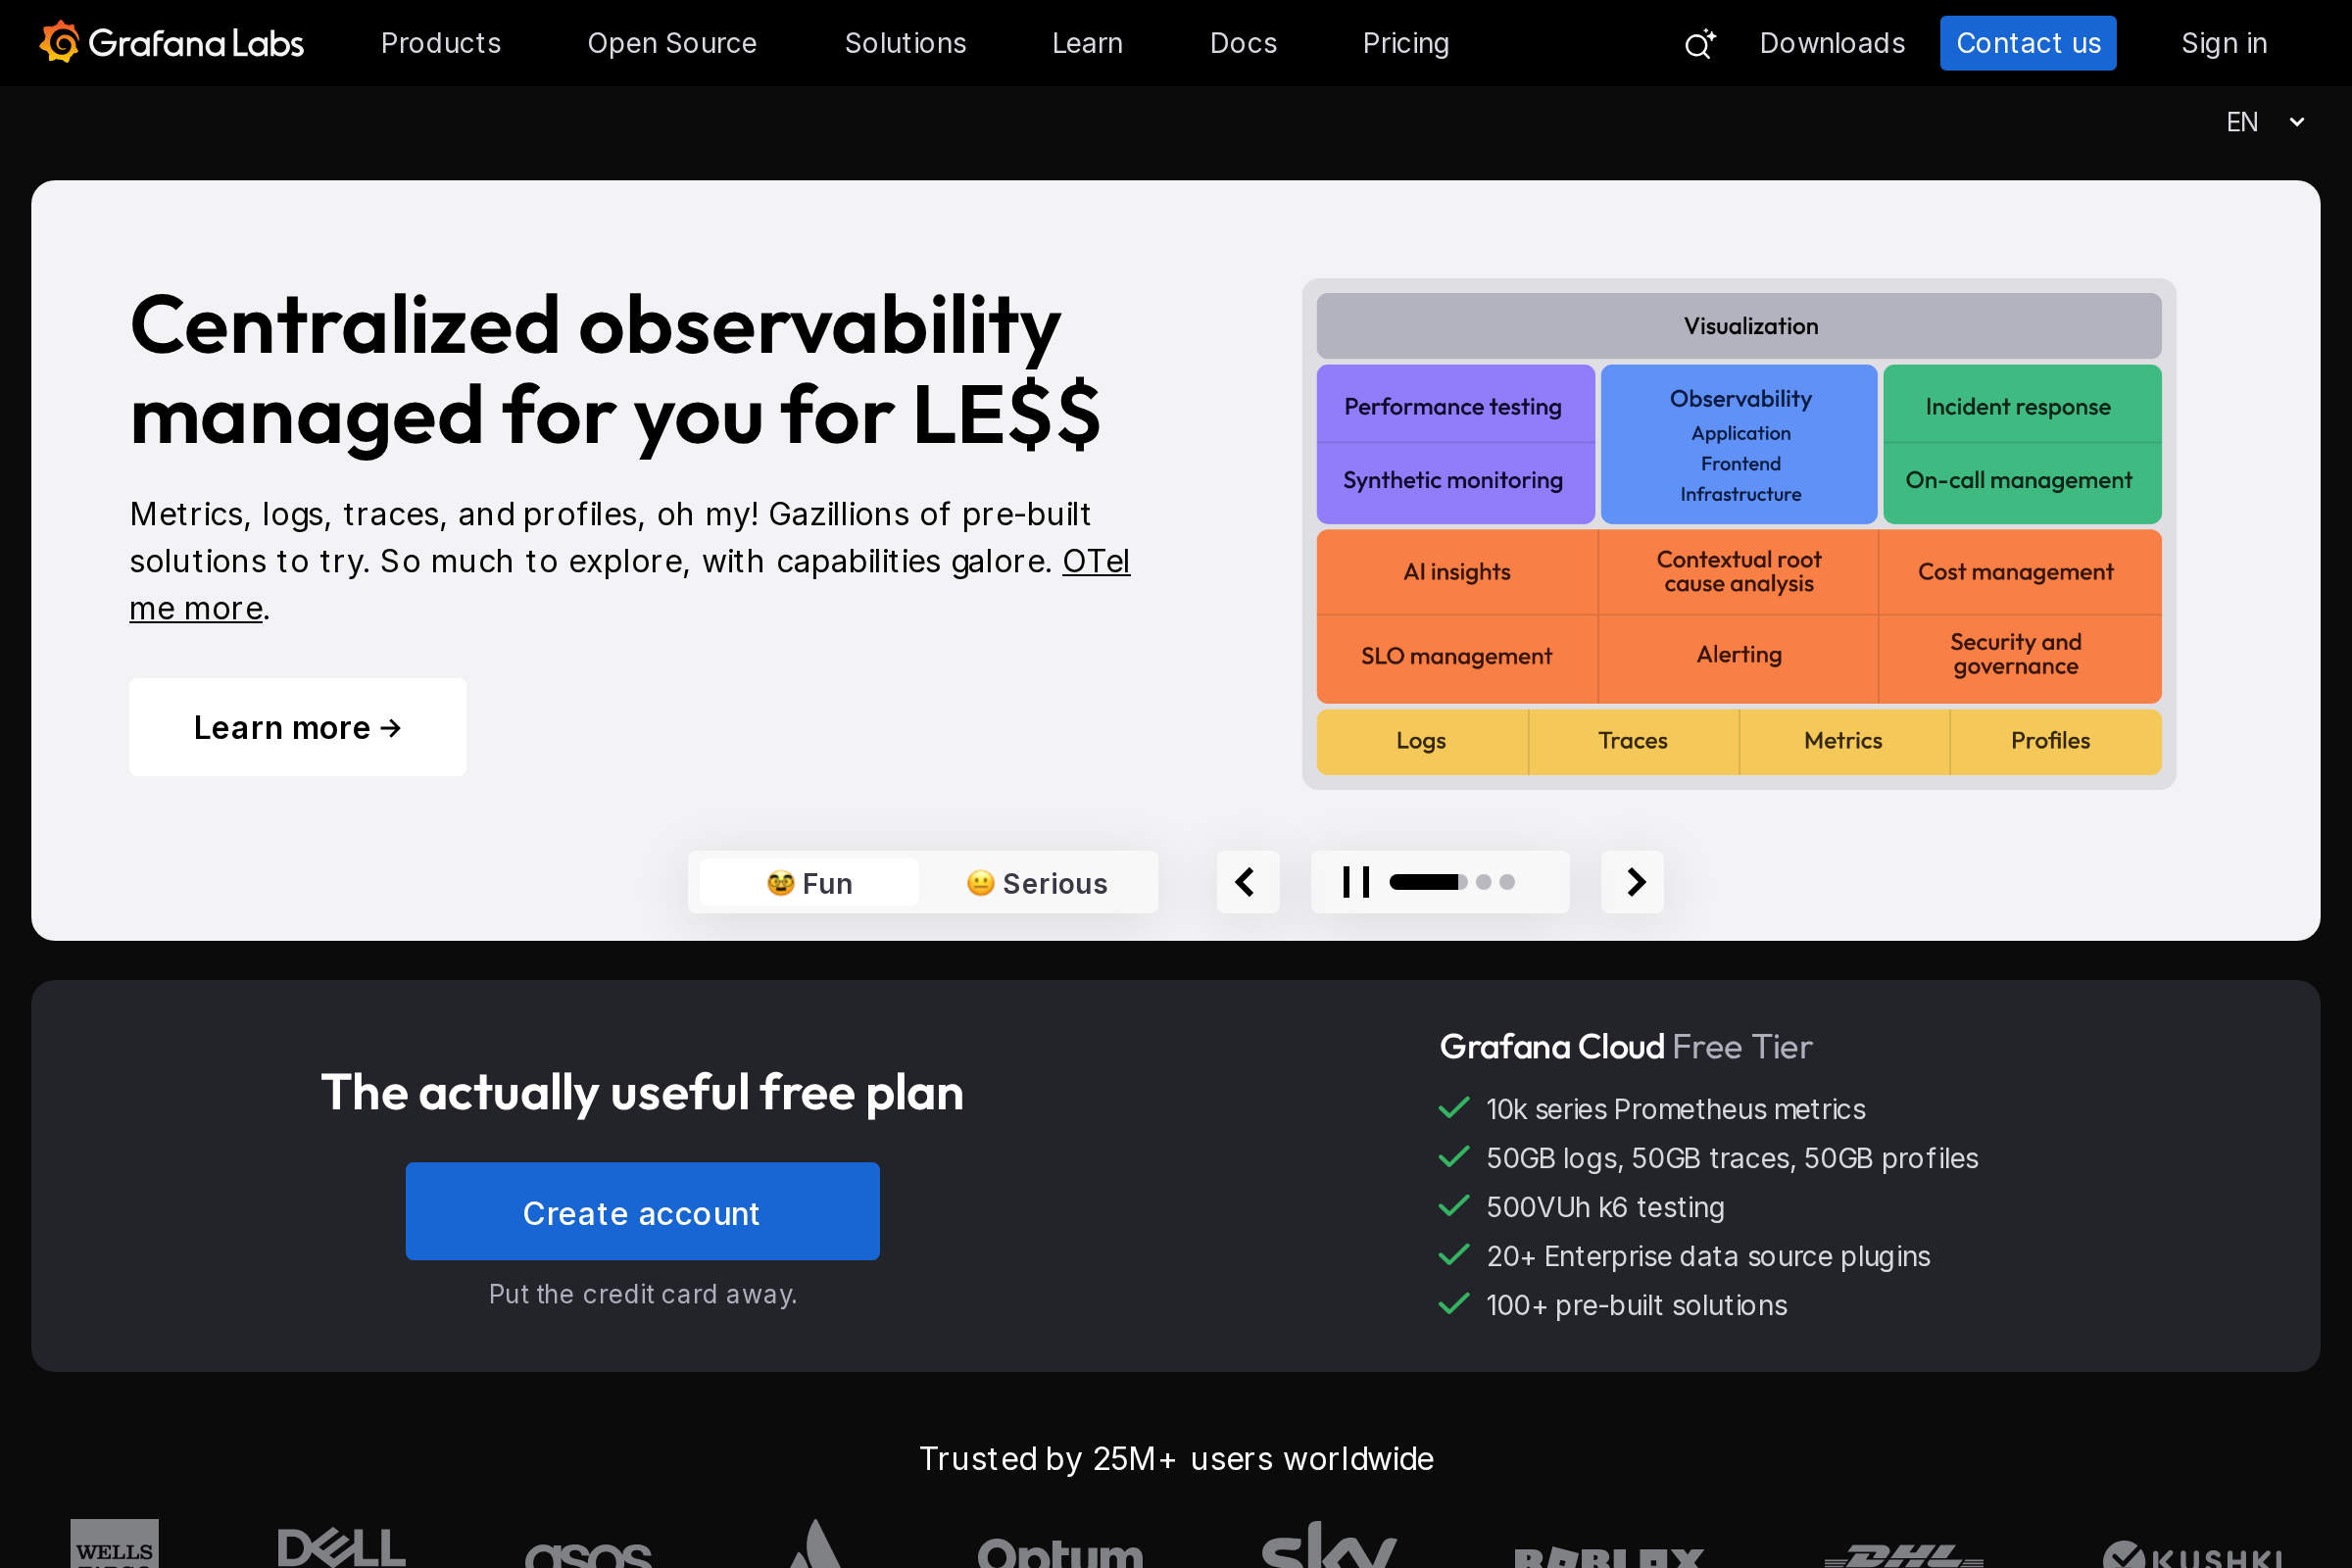
Open-source platform for monitoring and observability.
Grafana is an open-source data visualization and analytics platform designed to help teams monitor their applications, infrastructure, and databases in real-time. It is widely used for creating interactive and customizable dashboards that provide insights from various data sources. With support for a multitude of data sources like Prometheus, InfluxDB, and Elasticsearch, Grafana enables users to visualize their metrics, logs, and application data in a cohesive manner, facilitating quicker decision-making in DevOps environments.
One of the key features of Grafana is its ability to support multi-dimensional data visualization, allowing users to create dynamic dashboards with powerful querying capabilities. Additionally, Grafana is equipped with alerting features that notify teams when metrics cross predefined thresholds, ensuring they stay ahead of potential issues. Teams choose Grafana for its flexibility, active community, and extensive plugin ecosystem, which enables the integration of additional tools and services. Grafana offers both free and paid plans with advanced features such as enterprise security and collaboration tools, making it suitable for teams of all sizes.
One of the key features of Grafana is its ability to support multi-dimensional data visualization, allowing users to create dynamic dashboards with powerful querying capabilities. Additionally, Grafana is equipped with alerting features that notify teams when metrics cross predefined thresholds, ensuring they stay ahead of potential issues. Teams choose Grafana for its flexibility, active community, and extensive plugin ecosystem, which enables the integration of additional tools and services. Grafana offers both free and paid plans with advanced features such as enterprise security and collaboration tools, making it suitable for teams of all sizes.


Product
Useful Links
Made with pure grit © 2026 Jetpack Labs Inc. All rights reserved. www.jetpacklabs.com