DevOps Articles
Curated articles, resources, tips and trends from the DevOps World.
Cube.js and Chart.js Example With Dynamic Dataset
Summary: This is a summary of an article originally published by the source. Read the full original article here →
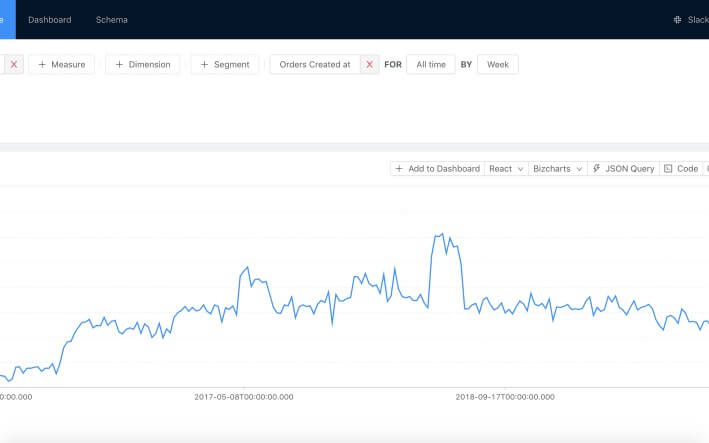
I've already covered building a static dashboard with Cube.js and Chart.js in this tutorial. Now, I’m going to show you how to dynamically change the underlying chart’s data based on the user’s input. We’ll let the user pick a date range and, based on that, reload the chart.


Product
Useful Links
Made with pure grit © 2026 Jetpack Labs Inc. All rights reserved. www.jetpacklabs.com